Sales Dashboard in Power BI
Description
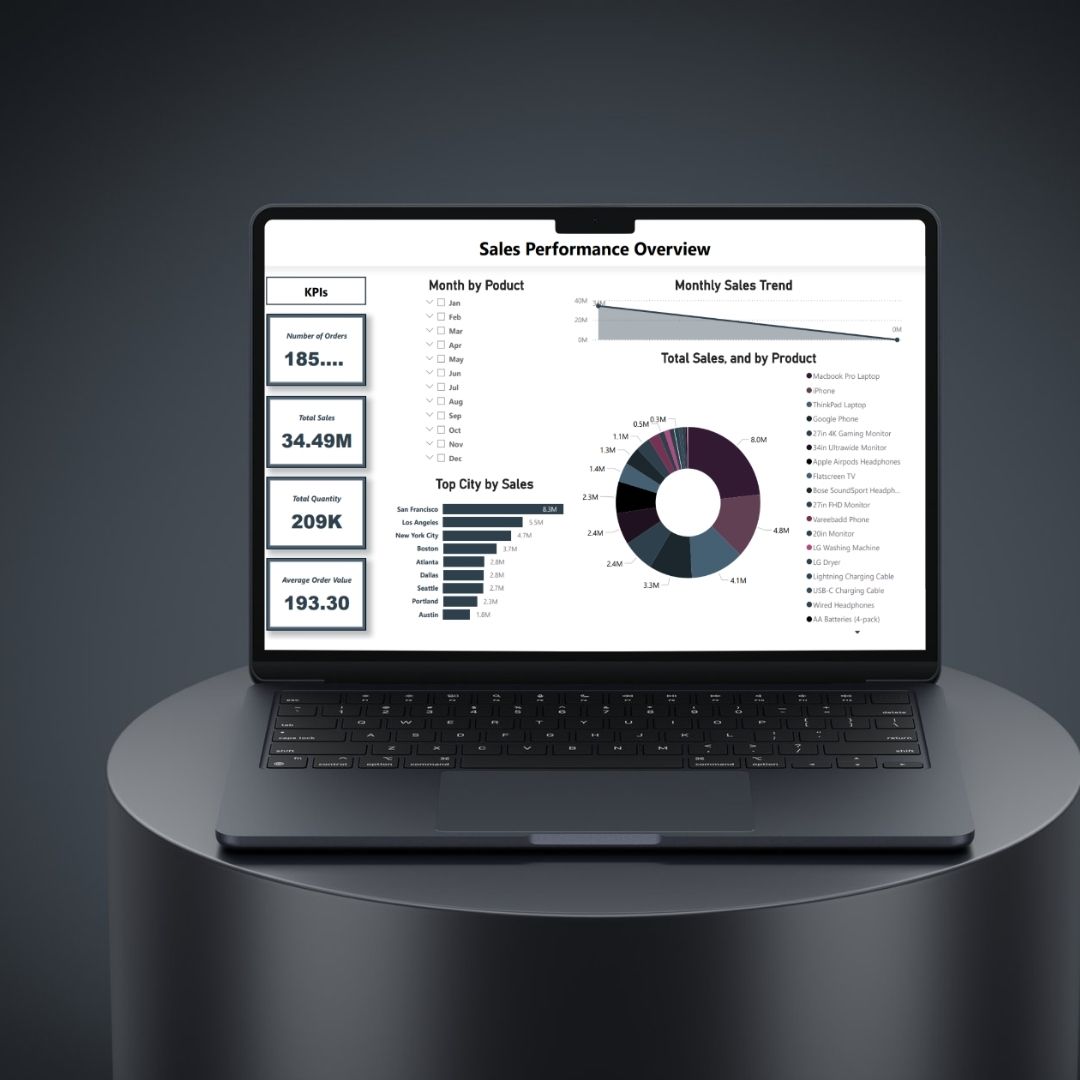
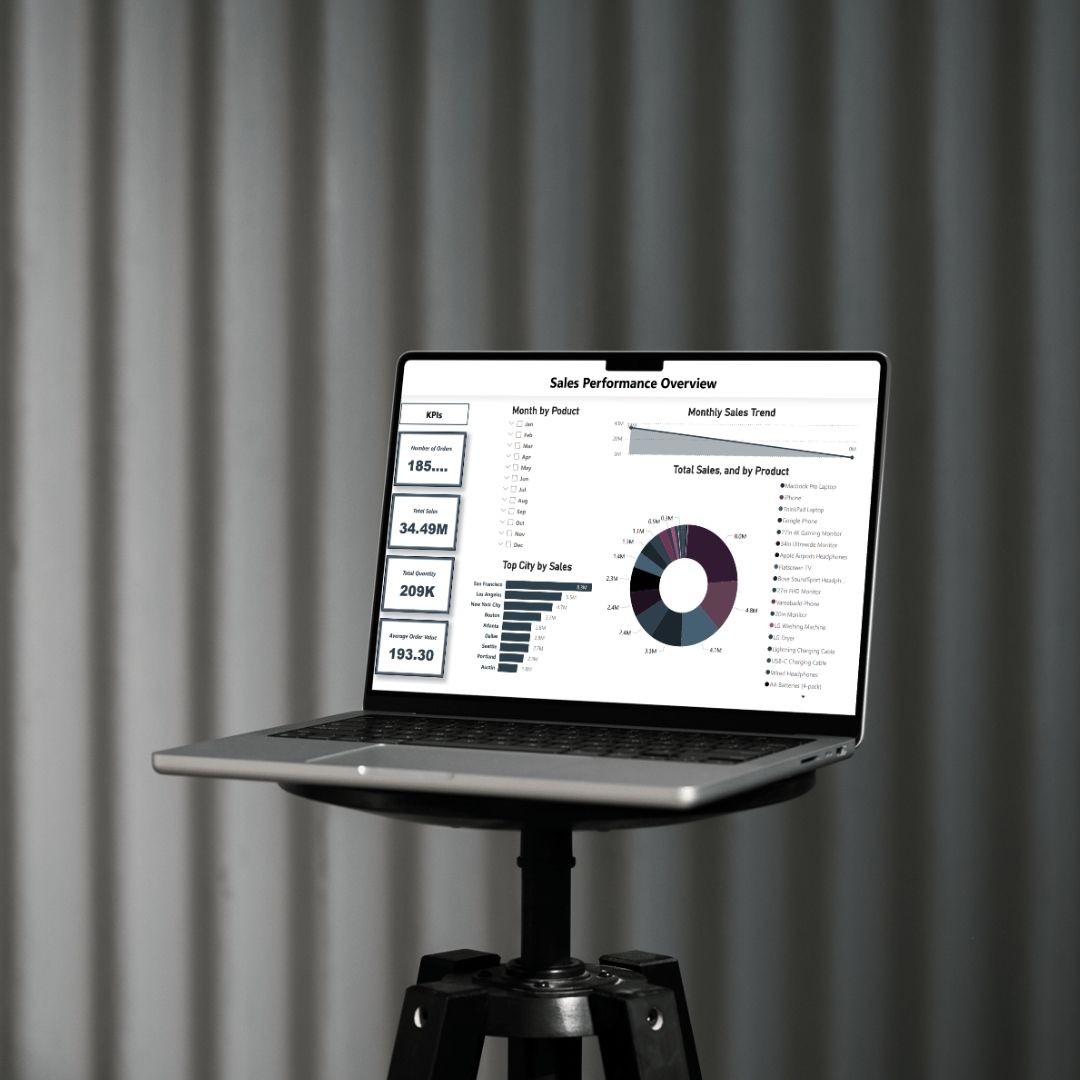
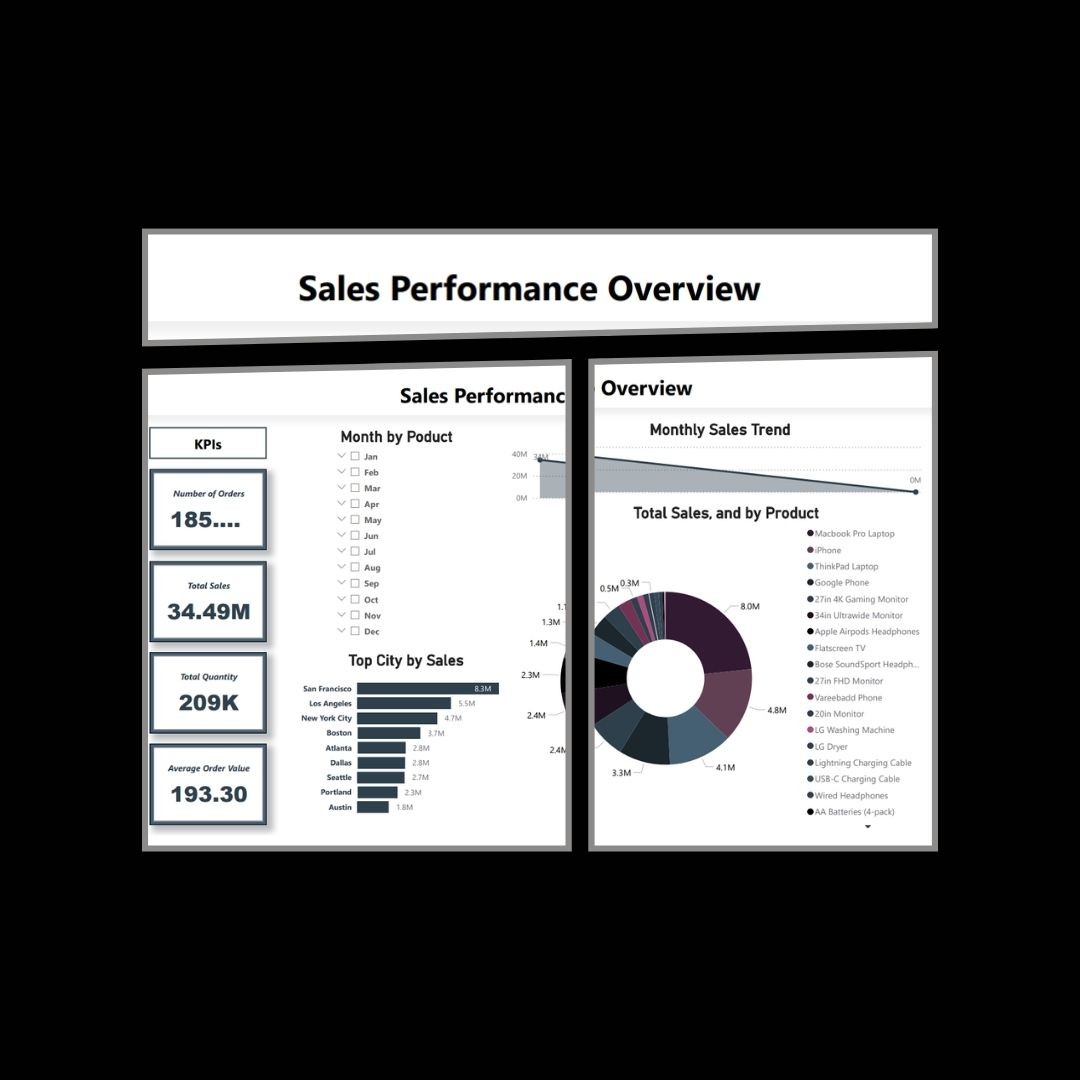
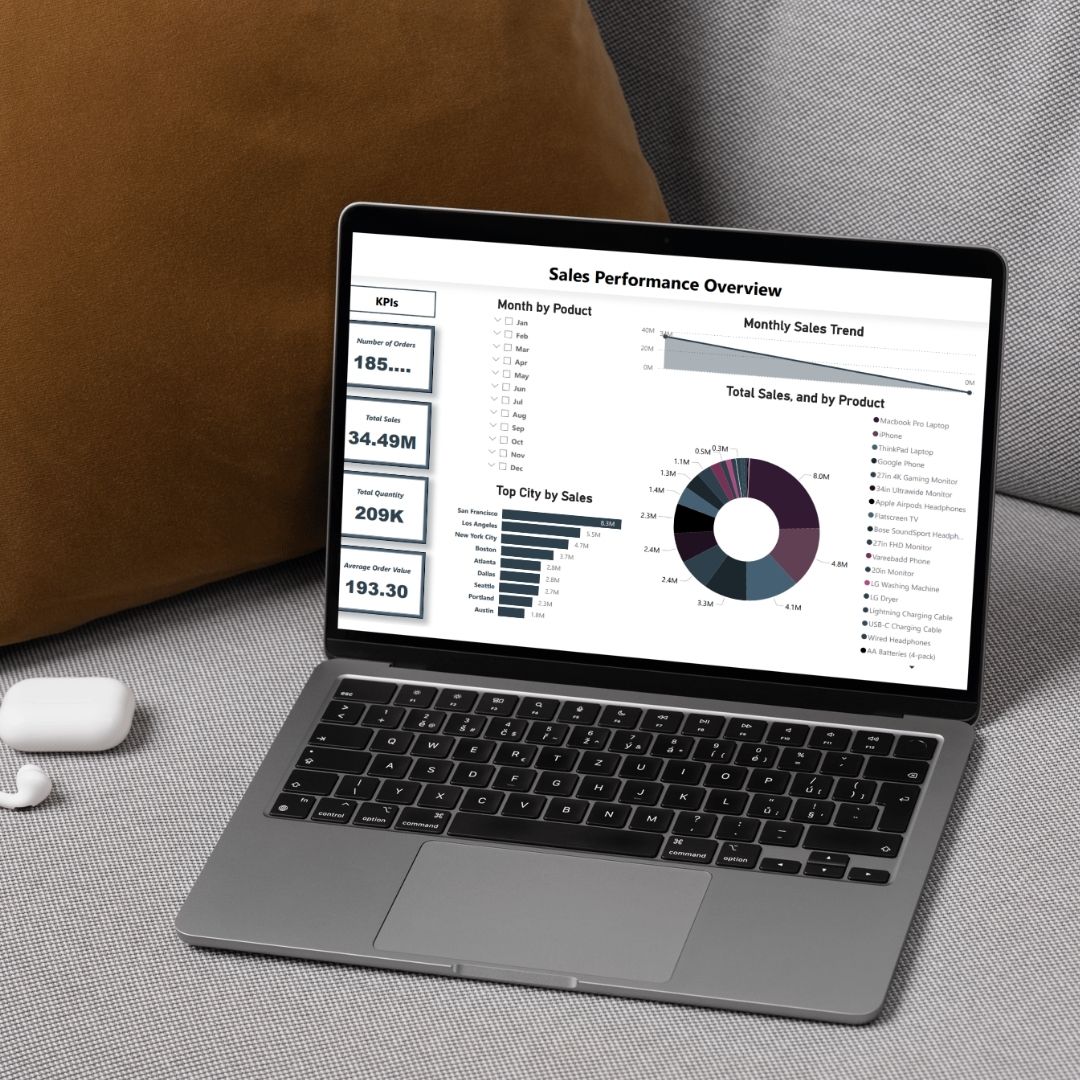
Developed an interactive Power BI dashboard to analyze over 10,000 rows of sales data. The dashboard highlights key metrics such as total revenue, top-selling products, regional performance, and monthly trends. Enabled dynamic filtering by region, category, and time period to help stakeholders quickly derive insights. This tool empowered the sales team to make data-driven decisions, optimize inventory, and identify new market opportunities.
Approach
Cleaned and transformed raw data using Power Query
Built DAX measures for KPIs like profit margin, growth rate, and YoY comparison
Designed a user-friendly layout with slicers, cards, bar/line charts
Shared dashboard via Power BI Service for real-time access
More works